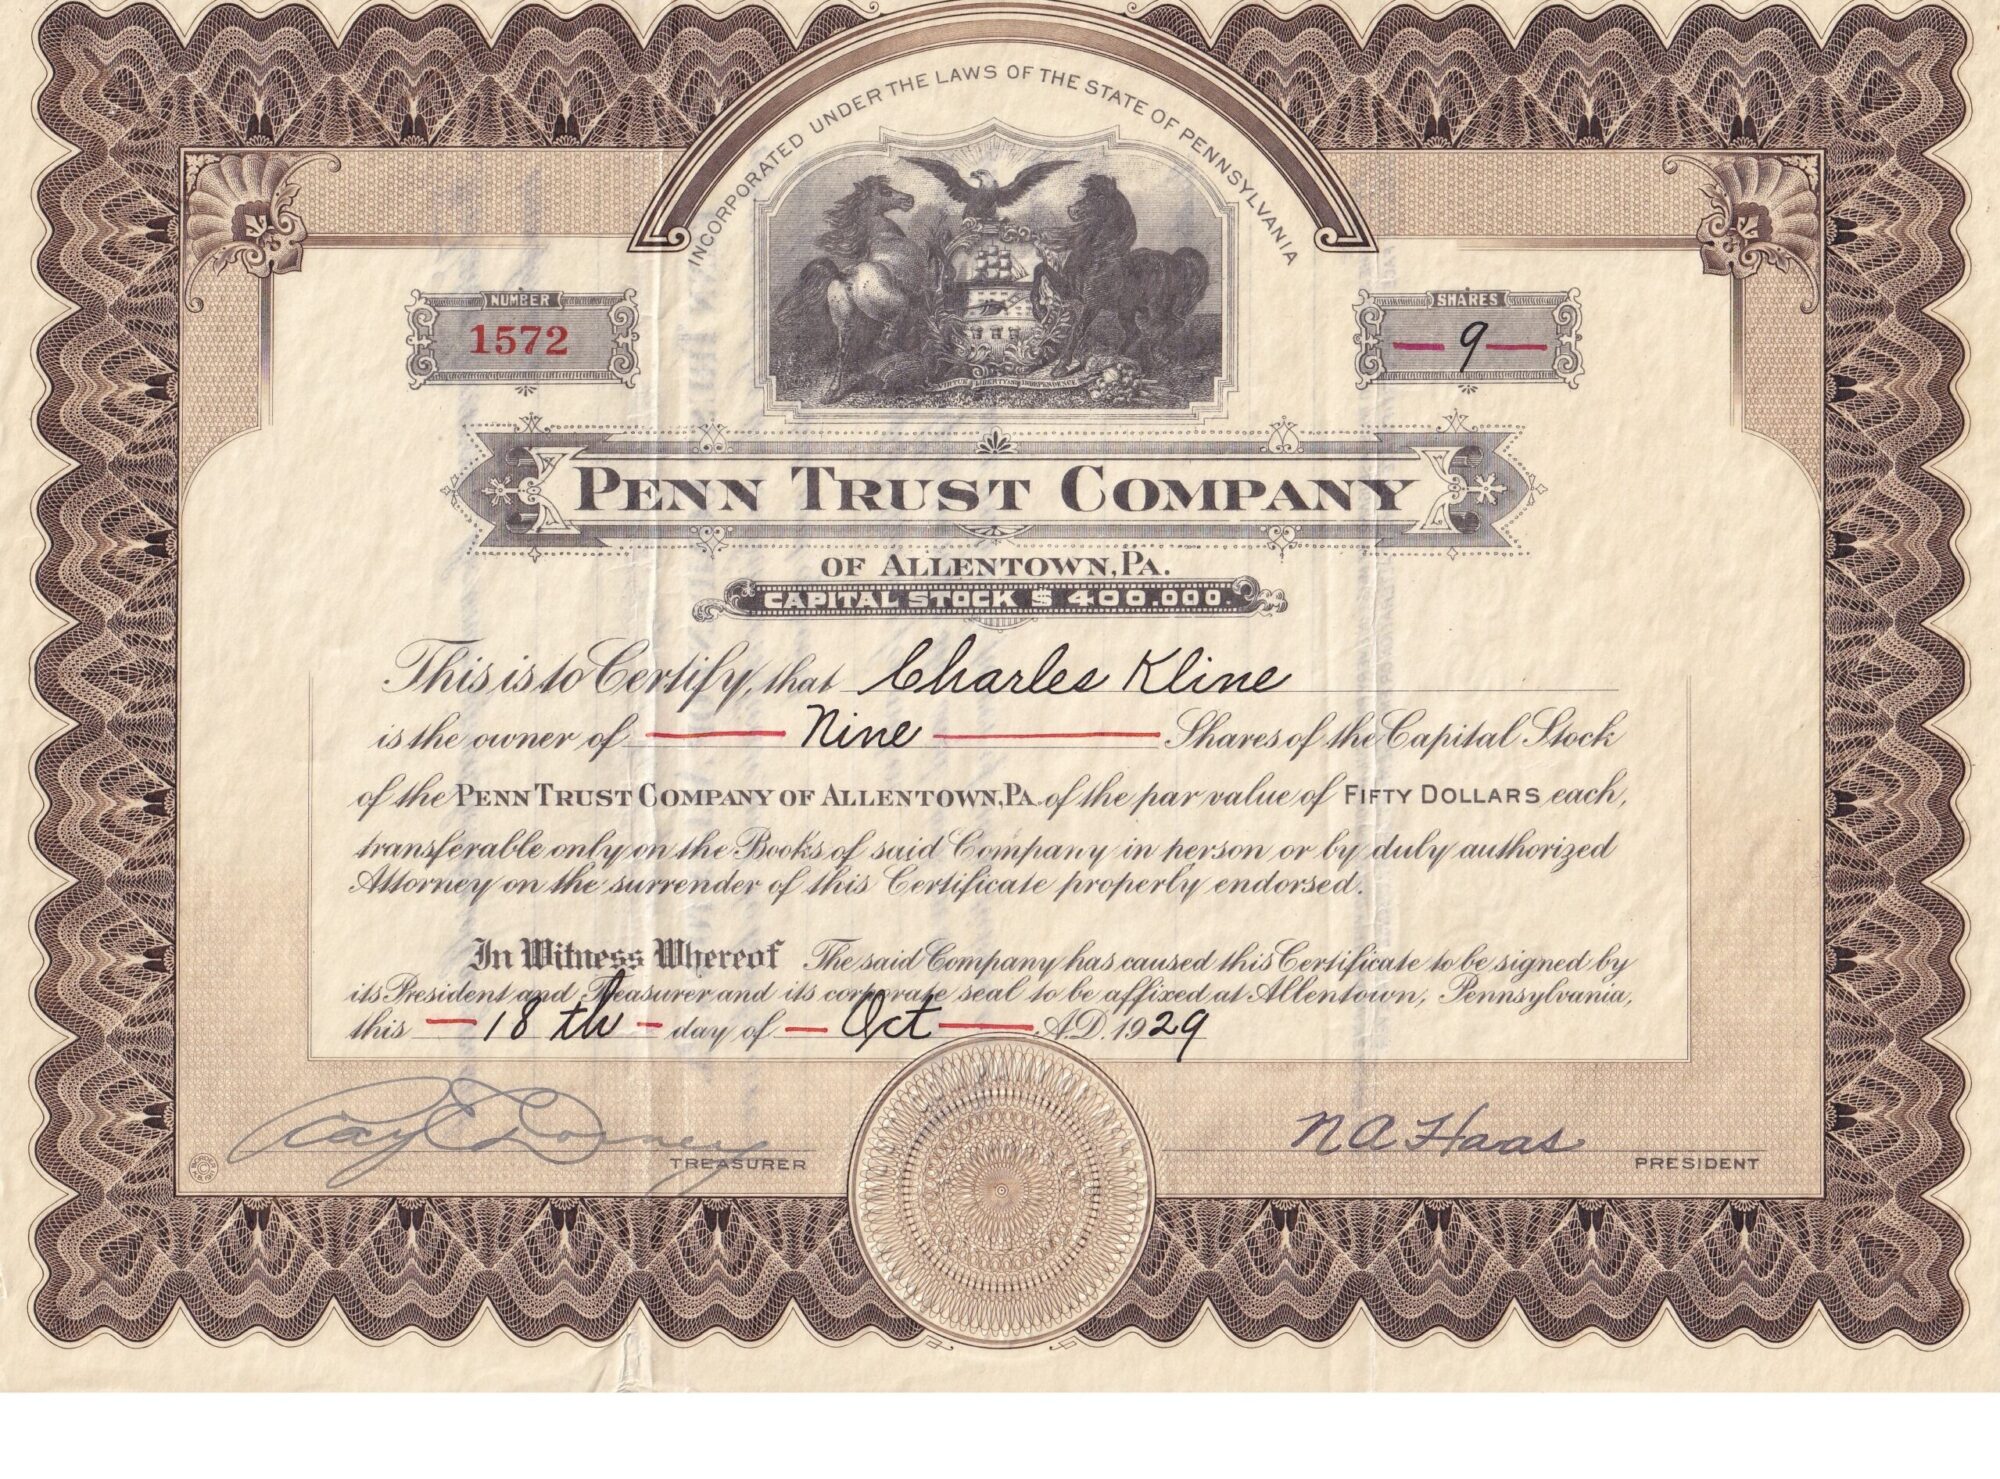
One hundred eighty eight years ago the S&P500 gained 32% between January 1835 and September 1835 before losing 72% of its value between October 1835 and July 1842. Ninety four years ago the S&P500 gained 29% between January 1929 and September 1929 before losing 86% of its value between September 1929 and June 1932. Both declines were followed by very long economic depressions.
Based on a 94 year timeline preliminary estimates indicate the S&P500 should gain 30% between January 2023 and September 2023 before starting a long decline and losing between 80% – 90% of its value. Additional data will be needed during 2023 to validate this thesis.
Just like 1837-1842 and 1929-1932, the next crash will be caused by congressional spending, recent government regulations, economic policies, presidential executive orders, and the misallocation of capital where everyone involved believes they can control the future.
Disclaimer
References:
Panic of 1837
https://en.wikipedia.org/wiki/Panic_of_1837
JACKSONIAN MONETARY POLICY, SPECIE FLOWS, AND THE PANIC OF 1837
http://www.nber.org/papers/w7528.pdf
Crisis of 1839
https://www.nber.org/papers/h0133
Sovereign Debt and Repudiation: The Emerging-Market Debt Crisis in the U.S. States, 1839-1843
https://www.nber.org/papers/w10753
History of Money and Banking in the United States: The Colonial Era to World War II
https://mises.org/library/history-money-and-banking-united-states-colonial-era-world-war-ii
The Great Crash and the Onset of the Great Depression
https://www.nber.org/papers/w2639
The Macroeconomics of the Great Depression: A Comparative Approach
https://www.nber.org/papers/w4814
Debt and Default in the 1930s: Causes and Consequences
https://www.nber.org/papers/w1772